

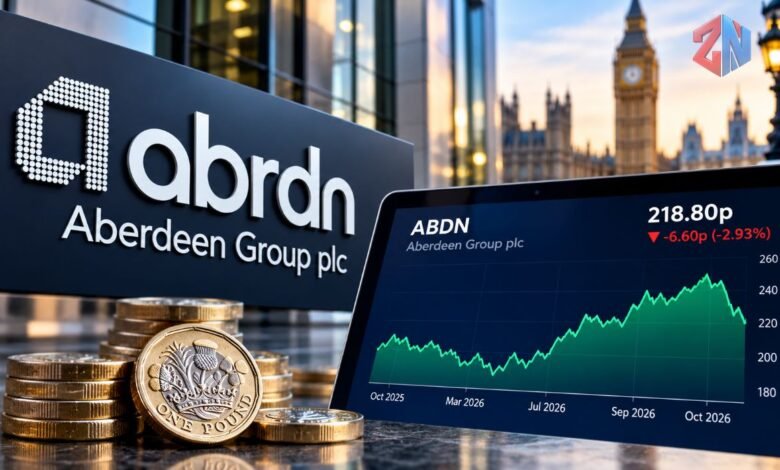
The abrdn share price chart helps investors track Aberdeen Group’s stock performance, understand market trends, and examine changes in its valuation. Whether you are following daily movements or researching a long-term investment, knowing how to interpret the chart can make financial information easier to understand.
Formerly known as abrdn plc, the company now operates as Aberdeen Group plc and trades on the London Stock Exchange under the ticker ABDN. This guide explains its recent share price movements, historical performance, dividend payments, financial results, and the main factors investors should monitor in 2026.
What Is the abrdn Share Price Chart?
The abrdn share price chart is a visual record of how Aberdeen Group shares have traded over time. It allows investors to compare historical prices, identify periods of volatility, and evaluate how the market has responded to company announcements.
The company trades under the symbol ABDN, which remained unchanged following its 2025 rebranding. Investors searching for either abrdn or Aberdeen Group will generally find the same listed company’s historical share price information.
Aberdeen Group Stock Information
| Detail | Information |
|---|---|
| Company name | Aberdeen Group plc |
| Former name | abrdn plc |
| Stock ticker | ABDN |
| Stock exchange | London Stock Exchange |
| Share price currency | British pence (GBX) |
| ISIN | GB00BF8Q6K64 |
| Business sector | Investment and wealth management |
| Latest referenced close | 218.80p on 22 October 2026 |
The quoted closing price is historical market data, not a live price feed. Prices can change during subsequent trading sessions, and different financial platforms may display slightly different figures depending on their data sources and update times.
Latest abrdn Share Price Chart and Market Performance
According to Investing.com’s historical market data, Aberdeen Group shares closed at approximately 218.80p on 22 October 2026. That compared with 225.40p on 21 October, indicating notable weakness over the two trading sessions.
For investors following the ABDN share price, these movements demonstrate why it is important to examine more than a single day’s percentage change. A short-term decline may look significant on a daily chart but appear smaller when viewed over several years.
Understanding Different Chart Timeframes
Most financial platforms allow investors to examine different periods:
- One day: Shows intraday trading movements and volatility.
- One month: Highlights recent price direction and market reactions.
- Six months: Helps identify medium-term trends.
- One year: Provides broader context for annual performance.
- Five years: Shows longer-term changes in investor sentiment.
Shorter charts are useful for monitoring market activity, while longer periods provide a better understanding of the company’s historical performance.
An upward line does not automatically indicate an attractive investment. Likewise, a falling chart does not necessarily mean the underlying business is deteriorating.
abrdn Share Price History and Historical Trends
The historical Aberdeen Group share price has experienced periods of recovery, decline, and consolidation. Its performance reflects changes in financial markets, company earnings expectations, investor confidence, and developments across the investment management industry.
Selected historical closing prices provide useful context. The figures below are dated market-data observations rather than a live interactive chart.
| Trading date | Share price |
|---|---|
| 22 October 2025 | 201.80p |
| 31 March 2026 | 189.80p |
| 31 July 2026 | 240.60p |
| 30 September 2026 | 248.40p |
| 22 October 2026 | 218.80p |
Market-data sources: Yahoo Finance for 22 October 2025 and 31 March 2026, TickerLandia for 31 July and 30 September 2026, and Investing.com for 22 October 2026. Different platforms may report slightly different closing figures.
These observations illustrate how the price changed during 2026. Shares recovered from their March level before retreating from higher prices recorded later in the year.
Comparing 22 October 2025 with 22 October 2026 gives a price increase of approximately 8.4%. However, this comparison excludes dividends and should not be interpreted as total shareholder return.
Historical performance offers perspective, but it cannot establish where the stock will trade next.
Price Performance Versus Total Return
A regular share price chart measures changes in the market value of a share. A total-return chart also accounts for dividend income, normally assuming dividends are reinvested.
This distinction matters for companies that distribute regular cash dividends.
Someone examining only the share price may underestimate the historical return received by an investor who also collected dividends. Conversely, dividend income does not remove the possibility of capital losses.
Investors should check whether their chosen chart displays raw prices, adjusted prices, or total returns before comparing performance figures.
How to Read the ABDN Share Price Chart
Understanding a stock chart does not require advanced trading knowledge. Several common measurements can help explain what is happening.
Opening, Closing, High and Low Prices
The opening price represents the first traded price of a session, while the closing price reflects the final official price determined under the market’s closing process.
The daily high and low indicate the price range during that session.
If a share opens at 220p, reaches 225p, and closes at 222p, the movement shows buying and selling activity throughout the day. These figures are illustrative rather than actual Aberdeen trading data.
Trading Volume and Moving Averages
Trading volume measures the number of shares traded during a particular period. Higher volume may indicate increased market attention, particularly following financial results or unexpected announcements.
Moving averages smooth daily fluctuations to make longer-term patterns easier to see. The 50-day and 200-day moving averages are commonly used indicators.
Neither volume nor moving averages can reliably predict future prices on their own. Investors should consider them alongside company fundamentals and market conditions.
What Factors Influence the Aberdeen Group Share Price?
Several interconnected factors can influence how Aberdeen Group shares perform.
Investment Markets and Client Assets
Aberdeen operates in investment and wealth management. The value of assets it manages or administers is important because parts of its revenue depend on client assets and associated fees.
Rising markets can support asset values and revenue opportunities. Falling markets may create pressure, although the relationship is not always straightforward.
Client deposits and withdrawals also matter. Strong net inflows can indicate business momentum, while persistent outflows may create challenges.
Profitability and Operating Costs
Investors monitor operating profit, revenue, expenses, and cash generation to understand the company’s financial condition.
Improving profitability may support confidence in its business strategy. However, investors also consider whether earnings growth is sustainable and how much future improvement is already reflected in the share price.
Interest Rates and Economic Conditions
Interest rates influence savings behaviour, investment demand, asset valuations, and financial market sentiment.
Economic uncertainty may encourage investors to reduce exposure to riskier assets. Stronger market confidence can support investment activity and demand for financial services.
Company-specific events and broader market developments can therefore affect ABDN shares simultaneously.
Aberdeen Group Financial Performance in 2026
Aberdeen’s financial announcements provide important context for investors examining its share price history.
In its half-year results announced on 29 July 2026, the company reported adjusted operating profit of £151 million, representing growth of 21% compared with the first half of 2025.
Net operating revenue reached £643 million, while assets under management and administration stood at £579.4 billion at the end of June.
October 2026 Trading Update
On 21 October 2026, Aberdeen published its third-quarter trading update, reporting total assets under management and administration of £578.9 billion at 30 September.
The figure was approximately 4% above the £556 billion reported at the end of 2025.
Other notable developments included:
- interactive investor recorded £2.5 billion in quarterly net inflows.
- The interactive investor customer base reached approximately 533,000.
- The Adviser business reported quarterly net outflows of £0.7 billion.
- The company reaffirmed its target of at least £300 million in adjusted operating profit for the full year.
These figures highlight different developments across the group. Growth in one division can occur alongside weaker flows elsewhere.
The profit figure for the full year was a management target, not a confirmed annual result. Investors should not treat it as guaranteed.
Financial announcements may coincide with share price changes, but establishing the cause of any particular market movement requires additional analysis.
Aberdeen Group Dividend History and Yield
Dividend payments are an important consideration for investors researching Aberdeen Group shares and reviewing the Aberdeen Group dividend history.
The company paid a final dividend of 7.30p per share for 2025 on 6 May 2026. It subsequently paid an interim dividend of 7.30p per share for 2026 on 22 September.
The interim payment followed an ex-dividend date of 13 August 2026.
How Dividend Yield Works
Dividend yield compares the annual dividend amount with the current market price.
For example, two payments of 7.30p would total 14.60p per share. At a hypothetical share price of 220p, this would represent an annual dividend yield of approximately 6.6%.
However, this calculation is illustrative. Future dividend payments are not guaranteed, and actual yields change as prices fluctuate.
Shares may also experience a downward price adjustment when they begin trading without entitlement to an announced dividend.
Investors should distinguish these expected adjustments from declines caused by worsening business performance.
Why Did abrdn Change Its Name to Aberdeen Group?
The company’s identity has changed several times during its history, which can create confusion when investors search for historical charts.
The abrdn brand was introduced in 2021. In March 2025, the company formally changed its name to Aberdeen Group plc.
Importantly, the London Stock Exchange ticker remained ABDN, and existing shareholders retained their holdings.
This means searches for the former company name and the current Aberdeen Group share price relate to the same listed business.
It is also important not to confuse Aberdeen Group shares with investment funds managed under the Aberdeen brand. Their performance, ownership structures, and risk profiles are different.
Where Can Investors Check the ABDN Stock Price?
Several established financial platforms provide charting tools for Aberdeen Group shares.
The London Stock Exchange publishes the company’s listing information and historical price chart. Aberdeen’s investor relations website also provides share information, financial announcements, and dividend records.
Financial services such as Yahoo Finance, Hargreaves Lansdown, and AJ Bell provide additional charting or market-data features. Some financial platforms identify the company’s London-listed stock as ABDN.L.
When comparing platforms, check the quote timestamp, currency, chart adjustment method, and whether prices are delayed. Anyone searching for the abrdn share price today should also confirm the date and time of the displayed quote.
A useful approach is to examine the daily chart first, switch to a one-year view, and then compare significant movements with dated company announcements.
Is Aberdeen Group a Good Investment?
Whether Aberdeen Group shares represent an attractive investment depends on the investor’s objectives, risk tolerance, and assessment of the company’s financial prospects.
The stock offers exposure to investment management and wealth services, but its performance remains sensitive to financial markets, client flows, profitability, and investor expectations.
Investors considering ABDN shares should examine dividend sustainability, operating performance, valuation, and the company’s ability to deliver its stated financial targets.
A falling share price can make a stock appear cheaper without necessarily making it better value. Similarly, a rising chart does not guarantee that future returns will be positive.
Conclusion
The abrdn share price chart provides a useful starting point for understanding Aberdeen Group’s market performance, from daily fluctuations to longer-term historical trends.
In 2026, the company’s financial progress, changing market conditions, and dividend payments have all been relevant considerations for investors.
The most useful approach combines chart analysis with financial results, dividend records, and company announcements. This gives readers a more complete picture than following price movements alone.
Investment information notice: This article is for general information only and does not constitute personal financial advice. Share prices and dividend income can fall as well as rise, and investors may receive less than they originally invested.
Also Read: This Is Money: UK Finance News, Savings & Investing Guide
Frequently Asked Questions
What is the abrdn share price chart used for?
It shows how Aberdeen Group shares have traded over different periods. Investors can use it to examine historical trends, volatility, trading activity, and the market’s response to company announcements.
What is the current ticker symbol for abrdn shares?
The ticker remains ABDN on the London Stock Exchange, despite the company’s change of name to Aberdeen Group plc in March 2025.
Where can I find the latest Aberdeen Group share price?
The London Stock Exchange, Aberdeen’s investor website, and established investment platforms provide share prices and charts. Always check the quote’s timestamp because prices may be delayed.
Does Aberdeen Group pay dividends?
Yes. Aberdeen Group paid a 7.30p interim dividend on 22 September 2026 and a 7.30p final dividend for 2025 on 6 May 2026. Future payments depend on company decisions and financial circumstances.
Why does the ABDN share price fluctuate?
Price movements can reflect company profits, client fund flows, financial market conditions, dividend announcements, economic developments, and changing investor expectations.
Can the abrdn share price chart predict future performance?
No. Historical prices and technical indicators can help identify patterns, but they cannot reliably predict future performance. Company fundamentals and investment risks should also be considered.